How to Level Your Vehicle Using LiDAR Intensity Data
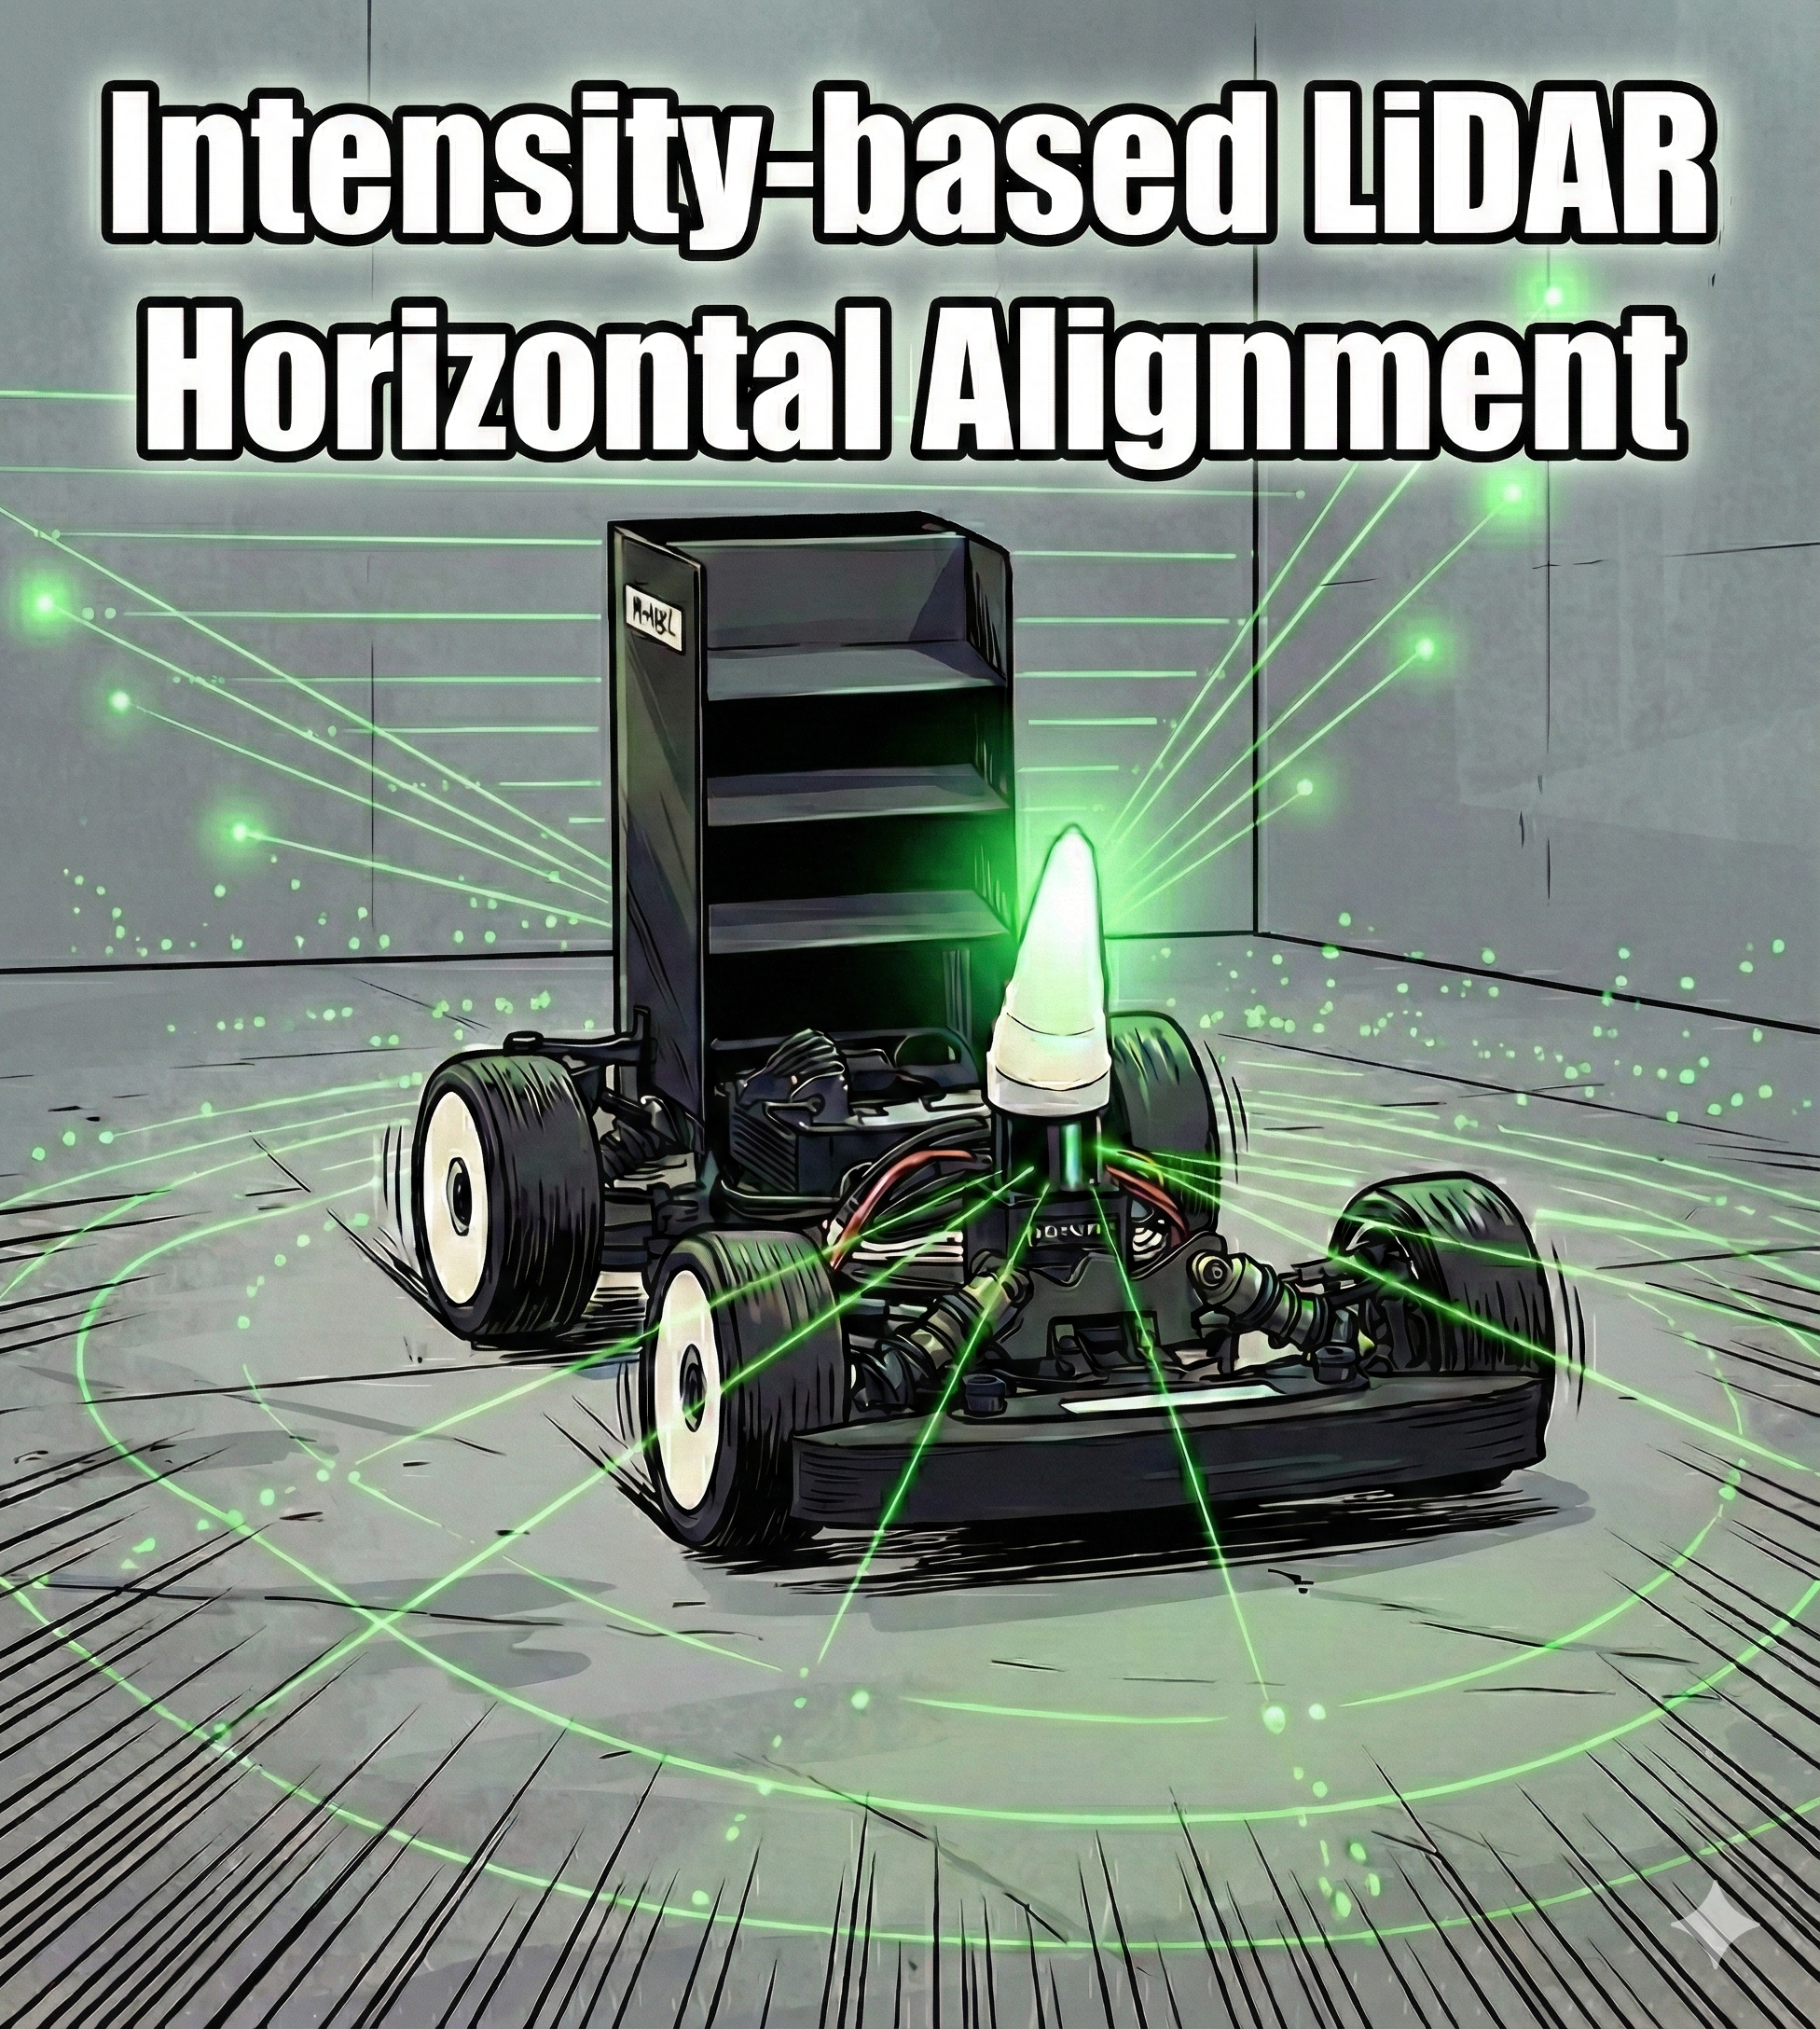
The physical leveling of a LiDAR sensor is a critical factor that determines the reliability of autonomous driving system data. This post covers how to visualize LiDAR Intensity data in RViz to assess and adjust vehicle leveling.
Why Vehicle Leveling Matters
When the sensor is not level, the following technical errors can occur:
- Ground Misclassification: If the sensor is tilted downward, it may recognize the ground surface as an obstacle, causing unnecessary emergency stops during path planning.
- Localization Failure: When scanning walls or surrounding features, data is collected at angles different from the actual trajectory. In this case, during the Scan Matching process, scan data may latch onto external walls rather than the track interior, causing a sharp decline in localization accuracy.
If the sensor is not level, it affects all subsequent autonomous driving processes (obstacle detection, localization, etc.), so it must be verified in advance.
Understanding LiDAR Intensity
A LiDAR sensor emits a laser and detects the energy reflected back from objects.
- Definition: It refers to the strength (signal intensity) of the reflected light.
- Material and Color: The absorption rate varies depending on the surface color and roughness of the object, causing Intensity values to change.
- Angle of Incidence: The more horizontally the laser hits an object, the more concentrated the energy, yielding consistent data. If the sensor is tilted, Intensity variation occurs even at the same point.
RViz Visualization Settings and Analysis Guide
Configure RViz as follows for accurate assessment.
Recommended Settings
- Color Transformer:
Intensity - Autocompute Intensity Bounds: OFF
- If auto-range is enabled, the color reference changes in real-time based on the surrounding environment, making it difficult to visually quantify leveling deviations. Use a fixed range to observe color changes.
- Min, Max Intensity can be adjusted according to the situation.
Intensity-Based Assessment Criteria
Intensity strength corresponds to the following colors. This varies depending on how you set the Min and Max Intensity values in RViz.
| Intensity Level | Color | Interpretation |
|---|---|---|
| Minimum | Red | Signal absorption, far distance, or poor angle of incidence |
| Intermediate | Yellow ~ Green | Normal reflection state |
| Maximum | Violet | Highly reflective objects (lane markings, reflective tape, etc.) |
Good State
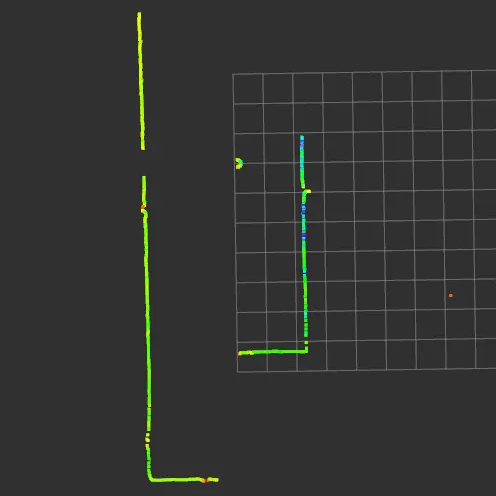
When scanning walls or ground of the same material, the color distribution appears uniform.
Bad State
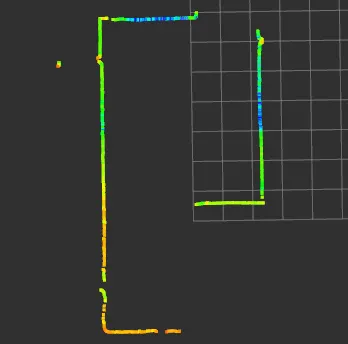
If the Intensity changes dramatically in a specific direction (e.g., yellow on one side, red on the other), or if the color distribution is widely spread at the same location, it indicates that the sensor is tilted to one side.
Hardware Leveling Adjustment
If data analysis confirms a leveling imbalance, perform physical adjustment.
- Use the shock absorber adjustment screws on the RC vehicle’s suspension system.
- With the vehicle placed on a flat surface, monitor the Intensity distribution in RViz in real-time while adjusting the left/right and front/rear shock absorber screws to level the sensor.
- Adjust until the ground and wall data maintain consistent Intensity colors (distribution) in all directions.
Always perform the adjustment on a flat surface and check the Intensity distribution in RViz in real-time while making adjustments.
Conclusion
This post covered how to use LiDAR Intensity data to assess and adjust vehicle leveling. The key point when visualizing Intensity in RViz is to turn off Autocompute and use a fixed range. If the color distribution is not uniform, physically adjust the leveling using the shock absorber adjustment screws. Sensor leveling directly impacts the reliability of autonomous driving data, so be sure to verify it before operation.